Plot Gene Network
Plot Gene Network
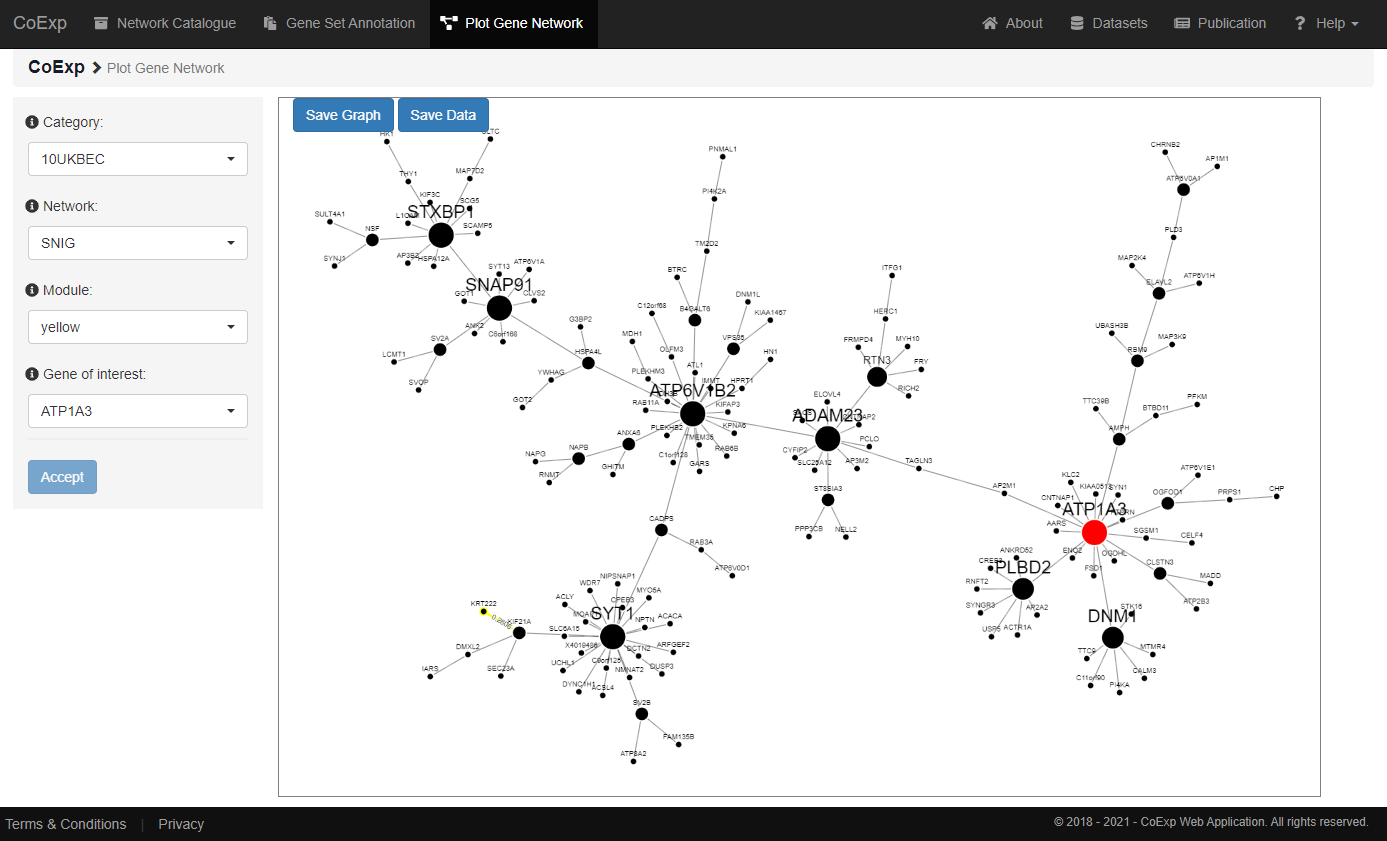
'Plot Gene Network' has been created to represent the most important genes neighbouring a gene/genes of interest through an undirected graph.
Following up with the example shown in 'Gene Set Annotation' tutorial, let us now visualize the gene 'ATP1A3' from the 'yellow' module,
'SNIG' network and '10UKBEC' category and its most important neighbouring genes.
After clicking the 'Accept' button, the plot is generated and the gene 'ATP1A3' appears as a very important gene within its module as it presents a node with a very high size.
In addition, a total number of 16 other genes appear neighbouring it.

Previous tutorial: Gene Set Annotation