Annotating your genes
Created: April 04, 2019Last updated: Jan 07, 2021
Gene Set Annotation
'Gene Set Annotation' has been created to annotate a list of genes by finding significant ovelaps between the genes from that list and the genes clustered within each module of the selected co-expression networks. While in the 'Network Catalogue' tutorial, we explained how to make use of that tab, we will explain in this tutorial how to use the "Gene Set Annotation" tab.Let us suppose that we have a list of genes that we would like to annotate in the CoExp Web Application. In this example, we would be interested in answering the following questions:
- Does our set of genes cluster together within a specific co-expression module in a particular tissue? If so, is that clustering happening more significantly than would be expected by simple chance?
- Is the module in which the group of genes clusters together enriched by genes with a specific biological function? If so, what is the reliability of that prediction for each gene of interest?
- Is the module in which the group of genes clusters together enriched for any kind of cell-type-specific marker?
- Is the clustering of the genes-of-interest unique to a specific module and tissue? Or, on the contrary, has it been observed within multiple gene co-expression networks?
Let us also suppose that our initial list of genes is composed of the monogenic forms of Parkinson's disease (PD), obtained from the Genomics England panel App (only the green genes):
ATP13A2 ATP1A3 C19orf12 CSF1R DCTN1 DNAJC6 FBXO7 FTL GBA GCH1 GRN LRRK2 LYST MAPT OPA3 PANK2 PARK7 PINK1 PLA2G6 PRKN PRKRA RAB39B SLC30A10 SLC39A14 SLC6A3 SNCA SPG11 SPR SYNJ1 TH TUBB4A VPS13A VPS35 WDR45
Following up with the example used in the 'Network Catalogue' tutorial, let's click on the Gene Set Annotation tab and, in the menu placed on the left-hand side of the webpage select the "SNIG" tissues from the 10UKBEC category.
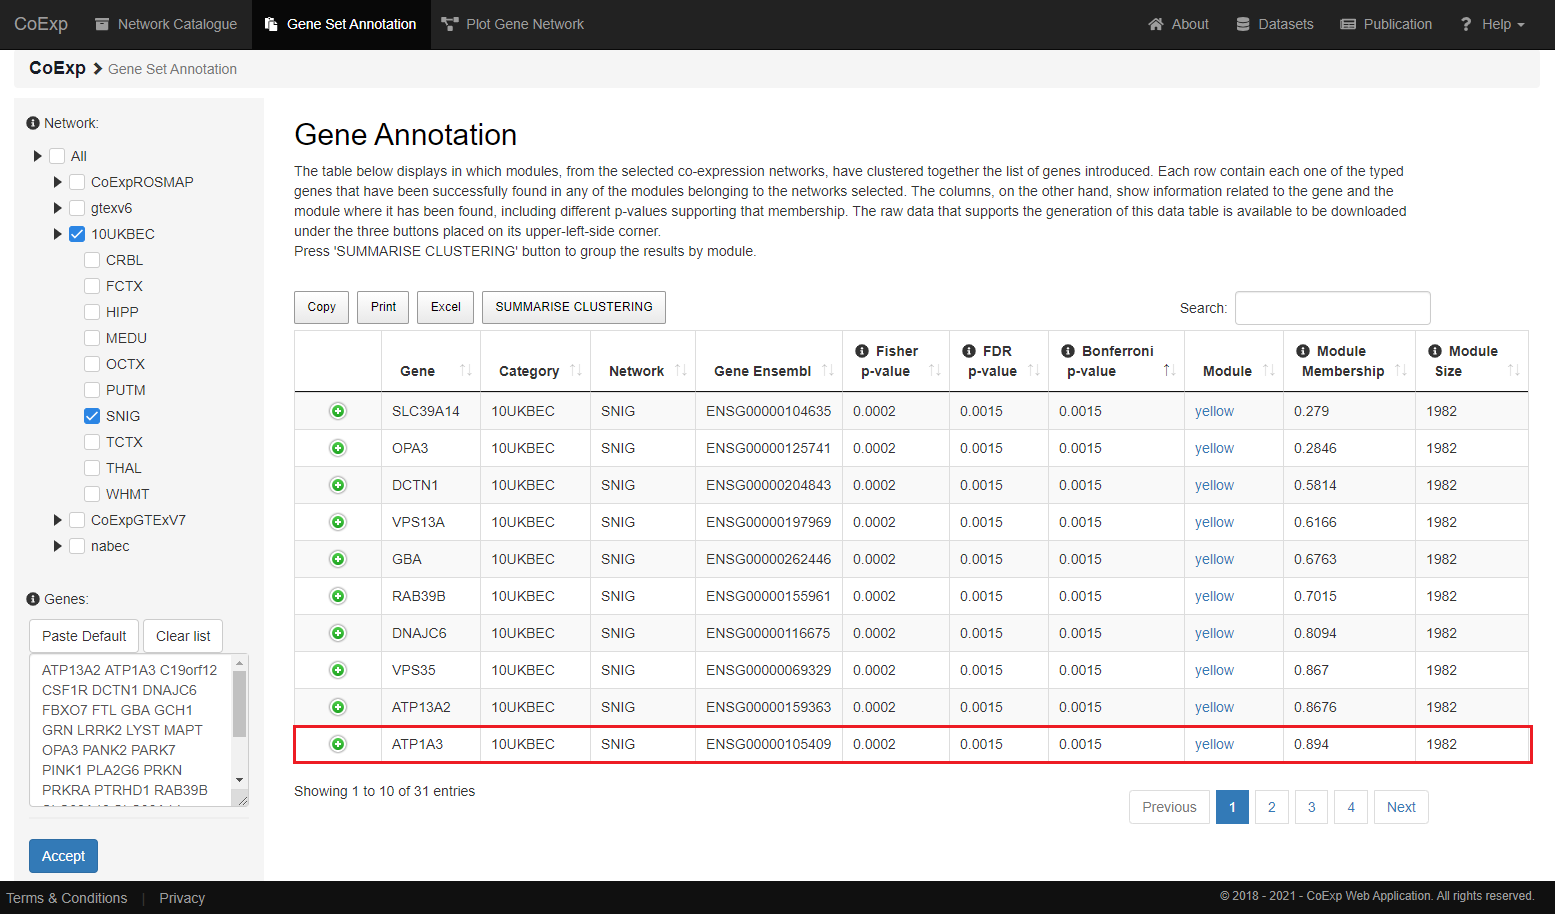
After clicking the 'Accept' button and if everything has gone as expected, we will be able now to see a similar table to the one below. Each row corresponds to each one of our input genes
(in case it has been found in any of the selected networks) found within each of the networks selected.
In this particular example, we have two different rows for each gene. Each row corresponds to each one of the tissues selected: the Substantia Nigra and Putamen networks. we can see that the gene 'ATP1A3' has clustered within the module 'yellow' with a significant p-value of
0.0015 (corrected by the Bonferroni method) and a high degree of membership to the module (value close to 1).

In addition, the columns from the data table returned contain the following information:
| COLUMN | DESCRIPTION |
|---|---|
| gene, category and network | These columns indicate one gene from our input list that has been found within one of the categories and network selected. |
| ensgene | This column contains the Ensembl name of the gene. |
| fisher, FDR and Bonferroni |
These three columns refer to a similar concept but expressed in three different ways.
That similar concept represents how significant is the overlap between your input genes and the genes that lie within each module belonging to your selected network. In particular, they mean:
|
| mm | This column refers to the module membership of the gene. Any value from above 0.5, is representing a strong value to be aware of. |
Trying with a different network
Let's now try with a different network. Let's select the 'Putamen' and 'Substantia nigra' networks from the 'gtexv6' category and click the 'Accept' button.
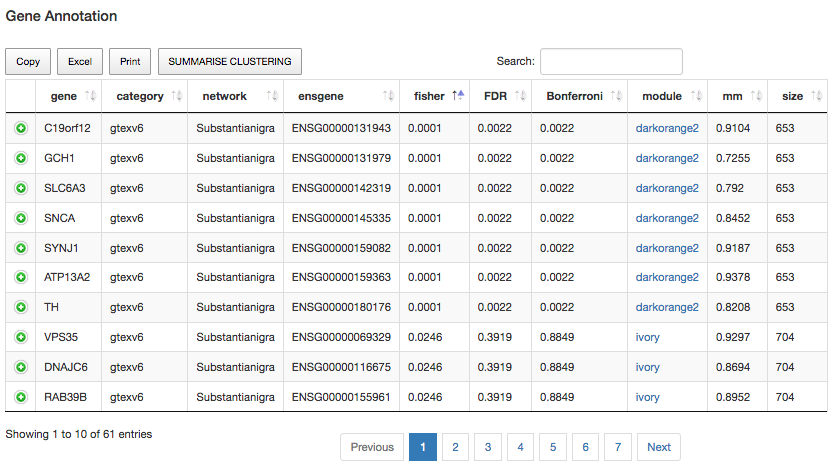
One of the first things we may now be wondering is how the genes cluster together across different modules. Exploring this is idea might be very interesting for many reasons. For example, all genes that cluster together in the same module will receive the same annotation, as the annotation comes from the module that they belong to as a whole. Therefore, the higher the number of genes from your input list belonging to a particular module, the stronger the link will be between the phenomena you are studying and the module's annotation. For example, if we now click at the top of the fisher column, we will visualize all Fisher p-values ordered from lower to a higher value. This will allow having a quick view of the most evident groups of genes per each module, as it follows:

Fig1: Gene clustering at the gene level.
In the image above, we can see that the genes C19orf12, GCH1, SLC6A3, SNCA, SYNJ1, ATP13A2, TH , are clustering together within the "darkorange2" module from "Substantia Nigra" tissue. We may also notice that the clustering is far away from being due to random chance. This is because of two main reasons. The first one is that Fisher's p-value is 10e-4, which is highly significant. Secondly, the Fisher's p-value obtained also survives from both FDR and Bonferroni corrections (their p-values are lower than 0.05). Another interesting point is that all genes seem to be playing a strong role within the darkorange2 module. As we mention before, values greater than 0.5 in the mm column represent strong values; in our example, we have obtained values very near to 1.
Let us explore these results in greater depth. For example, if we click now over any of the darkorange2 module links, a new popup window should appear. That new window will contain the "Catalogue Network" view, but showing all the specific details to the darkorange2 module. Thus, if we look onto the table data, we may notice that this module is enriched for REACTOME terms, such as "Axon guidance", and BP terms like "regulation of neurotransmitter levels". On the other hand, the cell type enrichment for the darkorange2 module is totally neuronal, including dopaminergic markers. In this sense, we may conclude that this module is clearly Parkinson related. In addition, this analysis suggests that all these genes are also implicated in different "cell type" processes obtained for "Substantia Nigra" tissue. Interestingly, you won´t see the same result replicated in the "Putamen" tissue, which might suggest that this phenomenon only happens in Substantia Nigra tissue, and not in the other PD-related tissues.
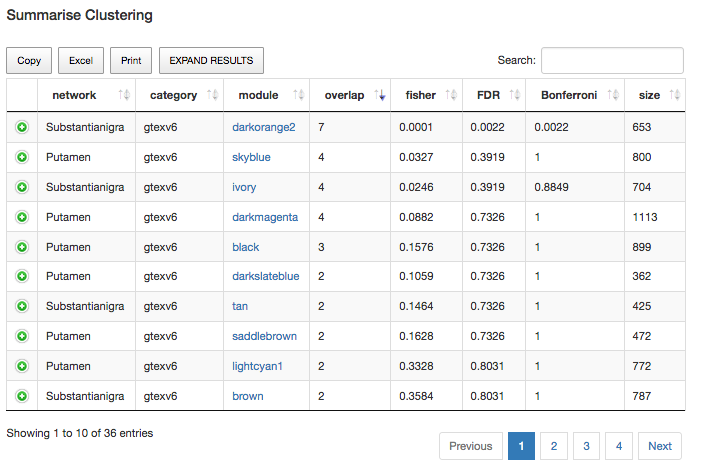
Another question we may want to answer is "are there other significant clusters in this analysis? To be able to answer that question, we will firstly click on the "SUMMARISE CLUSTERING" button, which is placed at the top of the table. After clicking it, a different view of the table will appear. This new view will show us the same results as before, but summarised now by the module. Next, if we order this new table by the "Overlap" column (which refers to the number of genes from our input set that fall within the current module), we will be able to get this table below:

Fig2: Summarized view of the gene annotation table focused on relevant gene overlaps with modules.
If we observe the results obtained in the table above, we could see that the only statistically-significant module is the darkorange2 one, within the Substantia Nigra tissue. However, notice the overlap of 4 Putamen-tissue genes that are clustering together in the skyblue module. Although the p-value obtained is not significant, this result may be pointing to something interesting. Please, notice that we are working on a panel of genes for monogenic PD, and the likelihood of this panel being incomplete is high.
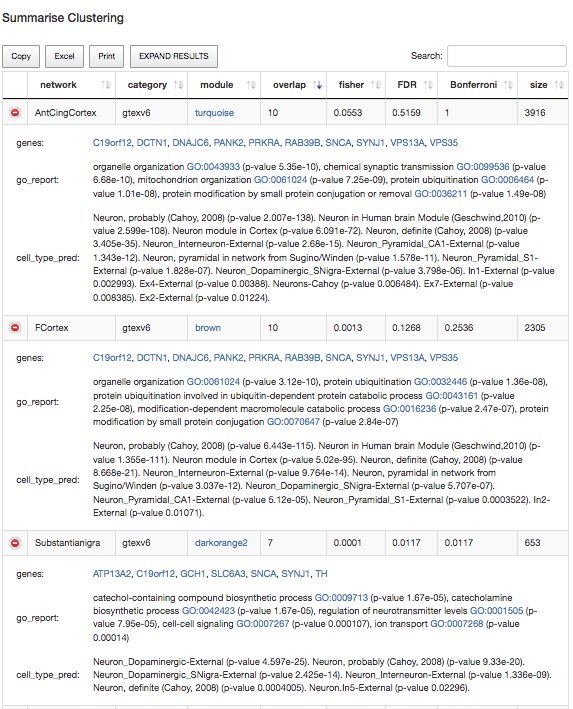
Let's now move onto the analysis of the whole set of brain tissues available in GTEx v6. As we did before, let's first to annotate the genes and then to open the summarized-clustering view. Finally, let's order the results by clicking over the "overlap" column. If everything has gone as expected, we should see a similar table to the following one:

Fig3: Almost identical results on genes and modules in nigra, frontal cortex and cortex tissues in GTEx.
The image above is showing us that an identical clustering of the genes C19orf12, DCTN1, DNAJC6, PANK2, PRKRA, RAB39B, SNCA, SYNJ1, VPS13A, VPS35 in both turquoise-Anterior Cingular Cortex and in brown-Frontal Cortex. This results in somehow similar to the one obtained in Substantia Nigra tissue. As a final thought, we may see that in this tissue the cell specificity signal is strongest in dopaminergic neurons.
Previous tutorial: Network Catalogue
Next tutorial: Plot Gene Network