Network Catalogue
Created: April 04, 2019Last updated: Jan 07, 2021
Network Catalogue
'Network Catalogue' has been created to find new biological function linkages and cell-type markers enrichment. This tab also allows the user performing exploratory analysis of the gene co-expression networks published to find such linkages.Gene Ontology
Let's run an example!
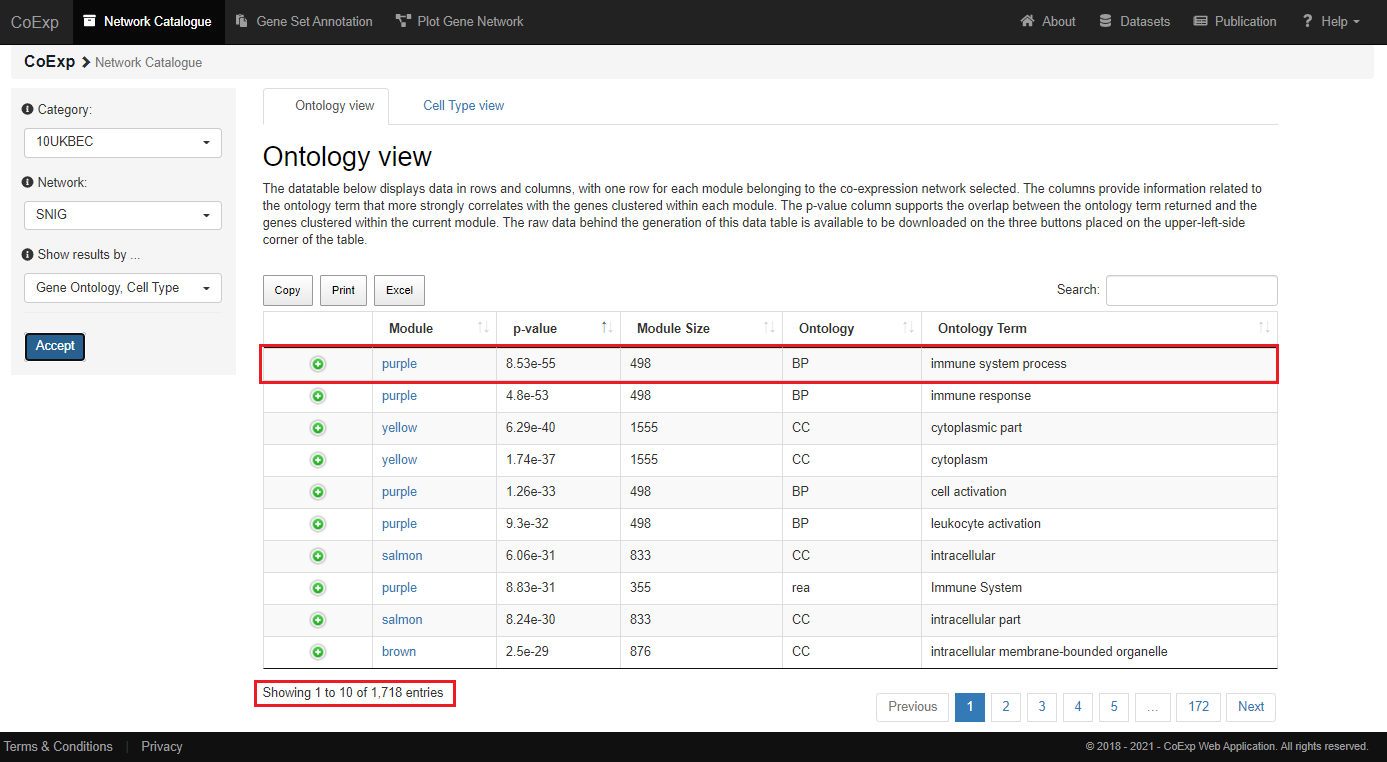
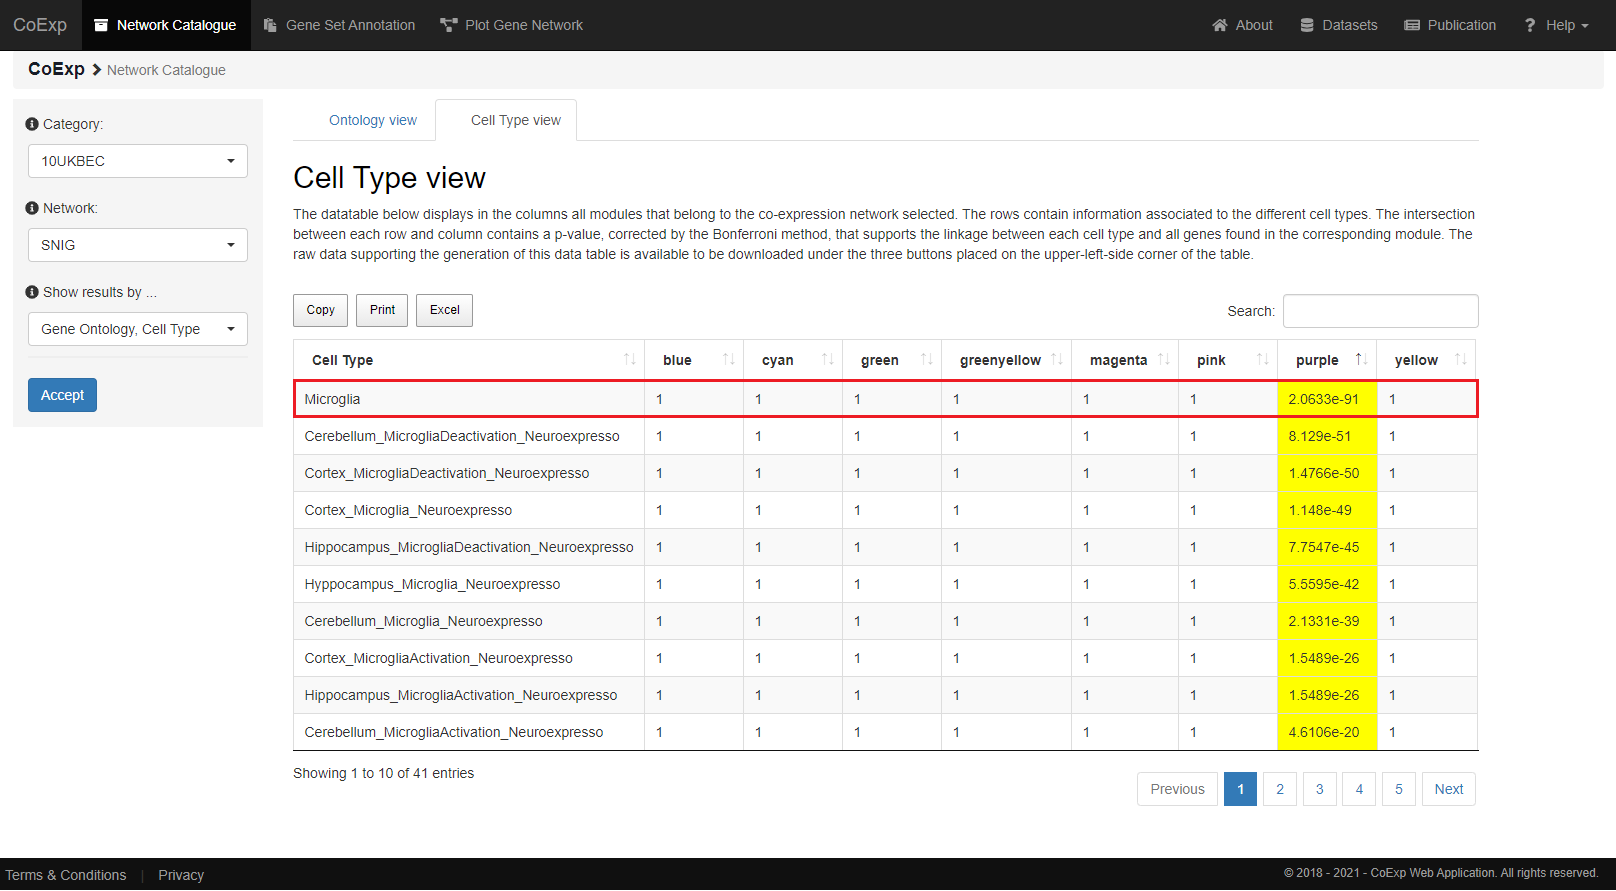
First, we select the '10UKBEC' category and its 'SNIG' co-expression network from the left-hand side menu. Second, we select both 'Gene Ontology' and 'Cell Type' views and click the 'Accept' button.
The 'Gene Ontology' view returns a datatable containing very useful information about the genes from the 'SNIG' network.
In this example, the module 'purple' clusters together 498 different genes from the UKBEC substantia nigra tissue,
linking them with the development or functioning of the immune system. That linkage is very unlikely to occur by chance (it is supported by a very significant p-value = 8.55e-55).

In this particular example, we can see that the "SNIG" network has returned 1718 annotations related to different biological functionality obtained from the Gene Ontology, REACTOME and KEGG pathways databases.
Now, let us suppose that we want to obtain all modules that present genes with significant association to the "RNA processing" term. For that purpose, we can use the "Search" field, which is placed in the upper right-hand side of the table. After typing "RNA processing" in that field, we have obtained only 8 modules that present genes significantly associated with the "RNA processing" term.
Please, also notice the three buttons ("Copy", "Excel" and "Print") placed in the upper part of the table. All of them will allow you to copy the content of the table to the clipboard, download that content into an excel file or send it to a printer. In addition, the columns from the data table returned contain the following information:
| COLUMN | DESCRIPTION |
|---|---|
| module | It contains the module, within the selected network, that the annotation term obtained refers to. Each module is named by one different color, therefore, each color represents each cluster where the genes have been grouped together. |
| p.value | To annotate each gene within each module, CoExpNets R package has used the gProfiler tool. This p-value column, therefore, refers to how significant is the overlap of genes associated with the term and the genes from the current module. |
| module.size | This column refers to the total number of genes found in the current module. |
| ontology | This column contains the annotation ontology terms. They can refer to Biological Processes (BP), Cellular Component (CC) or Molecular Function (MF) terms. All three are sub-ontologies from the Gene Ontology project. In addition, this column can also contain the terms "rea" and "keg", which refer to the REACTOME and KEGG ontologies respectively. |
Cell Type
Similarly, a very significant p-value (p-value = 2.06e-91) supports the linkage of the beforementioned 498 genes from the 'purple' module with microglia cell type.

Next tutorial: Gene Set Annotation